Case Study
Grata Lead Sourcing Web App
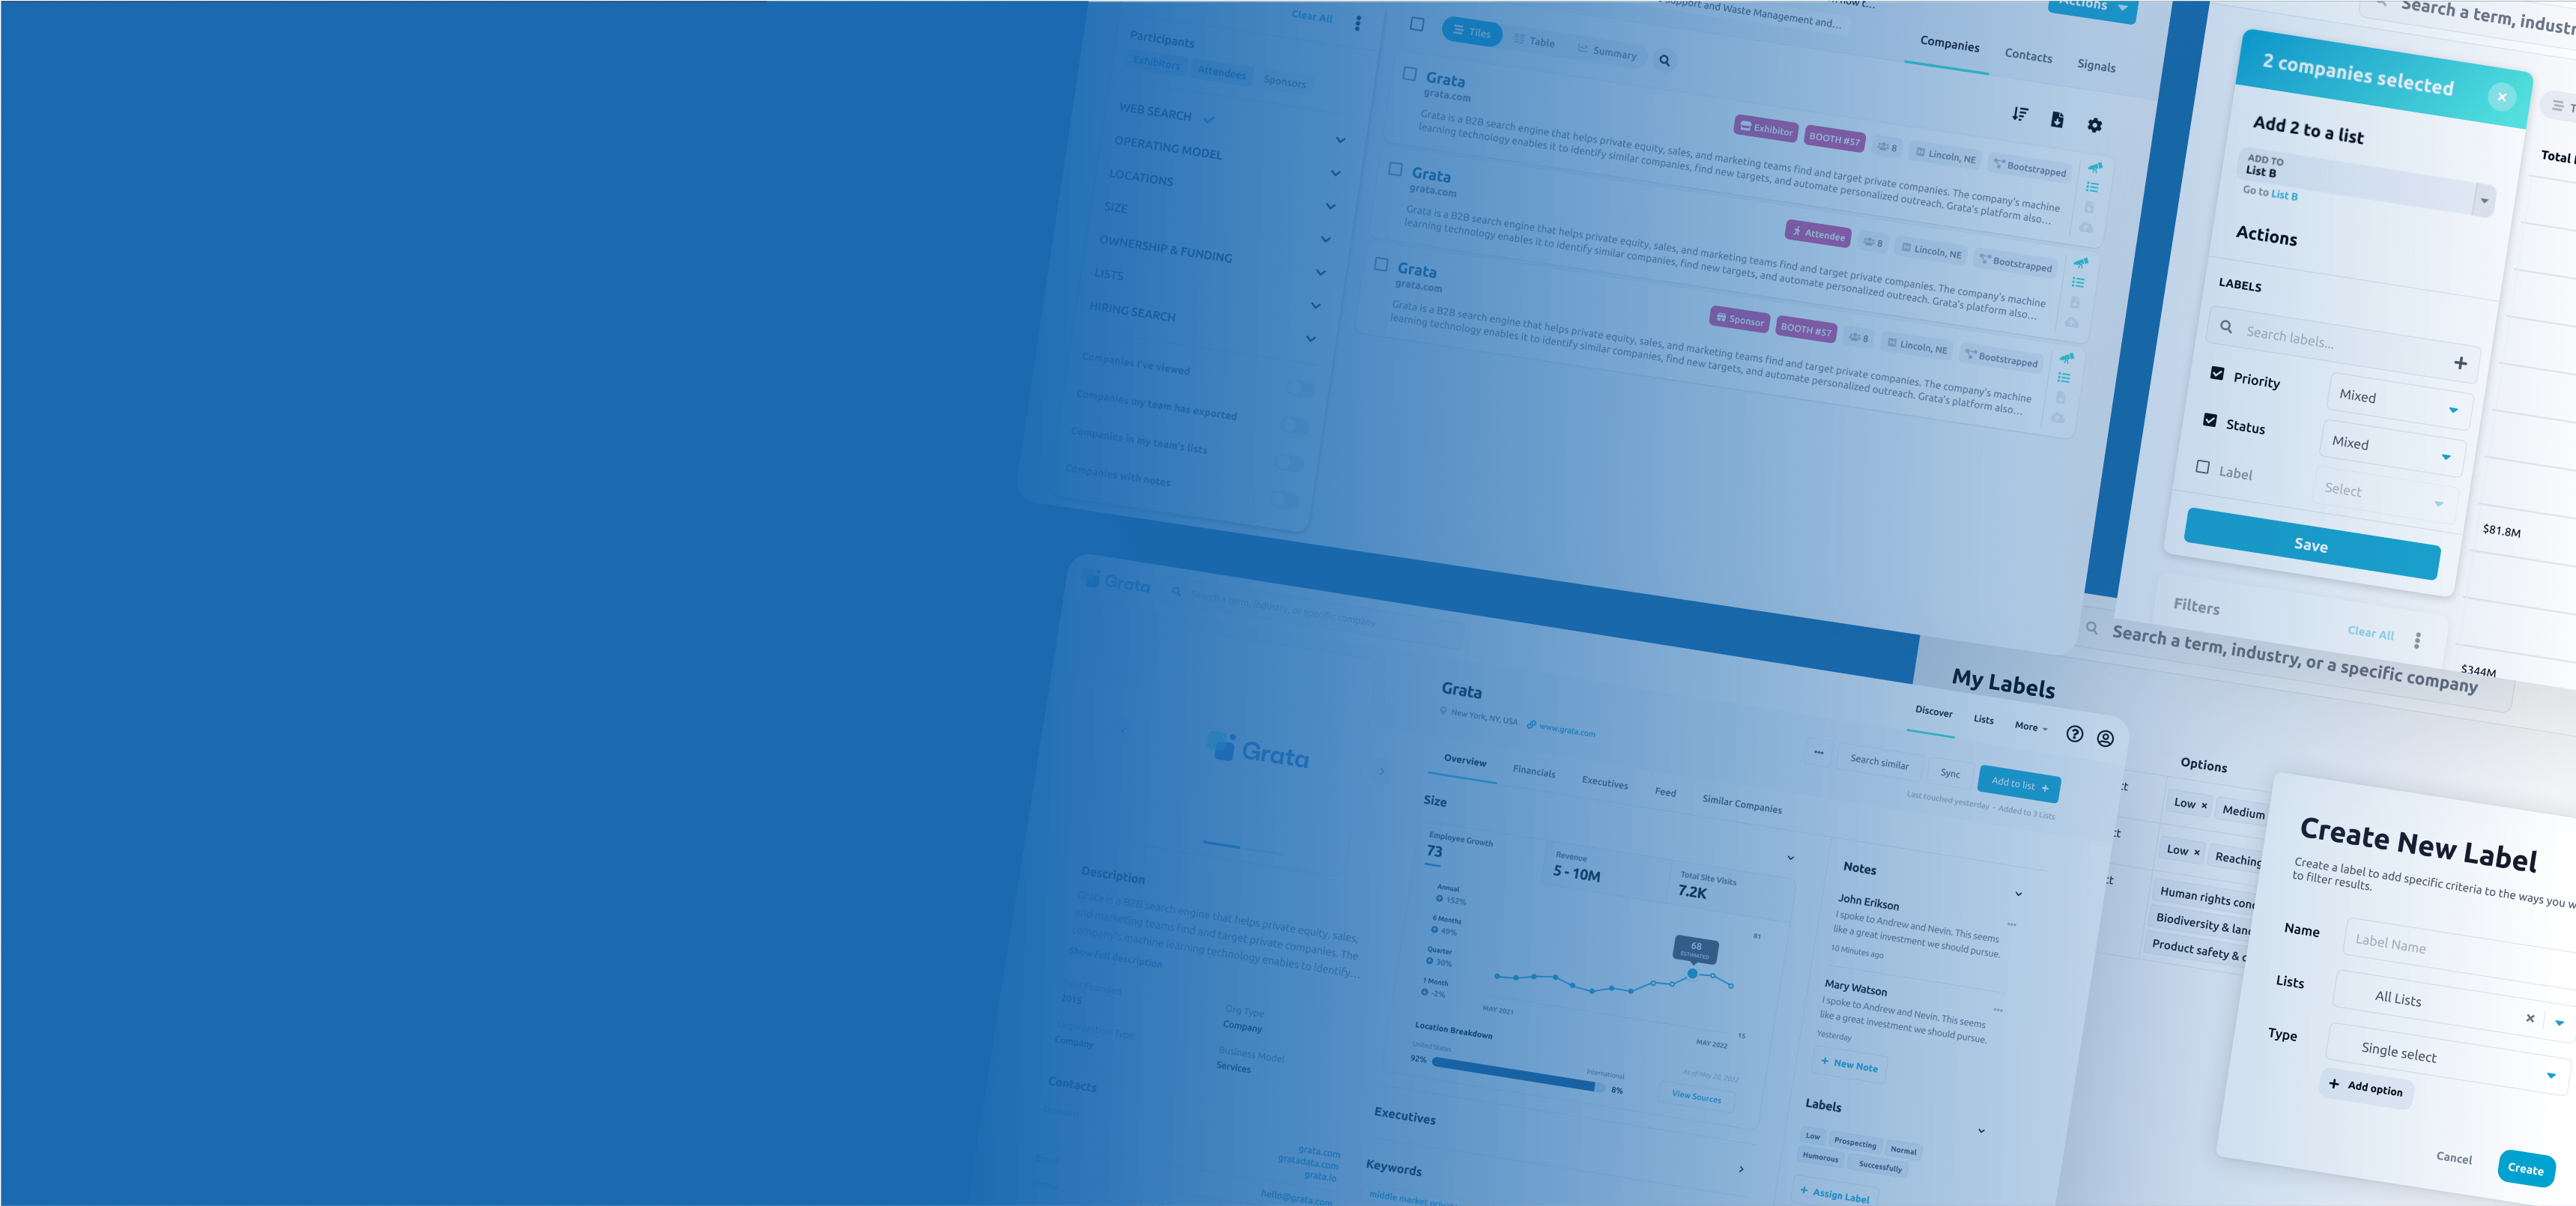
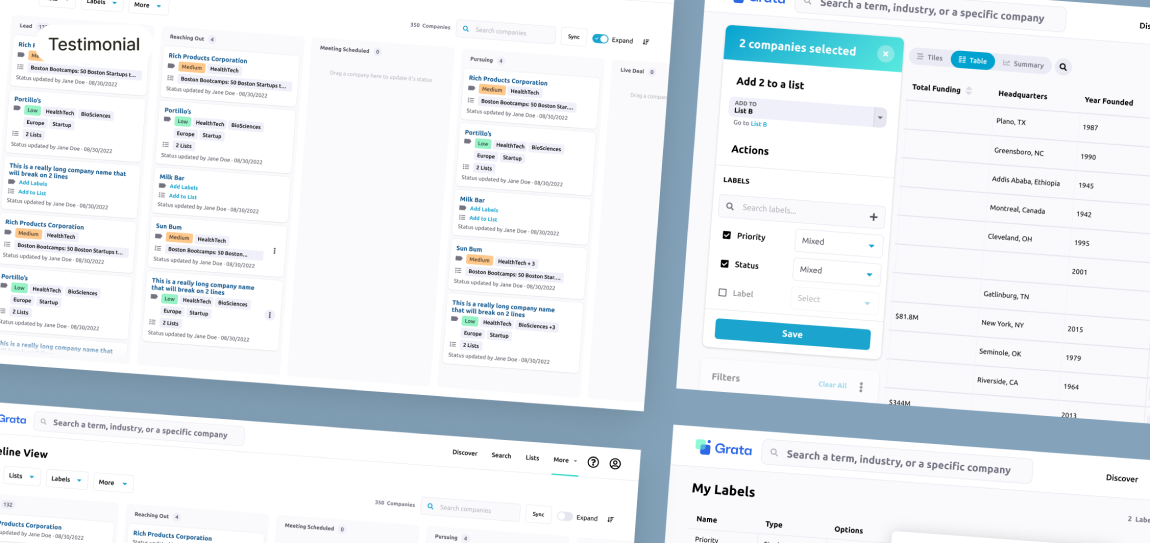
UX Cabin helped Grata build many high impact features, one of which was a Conferences event page that increased user engagement by 4x.
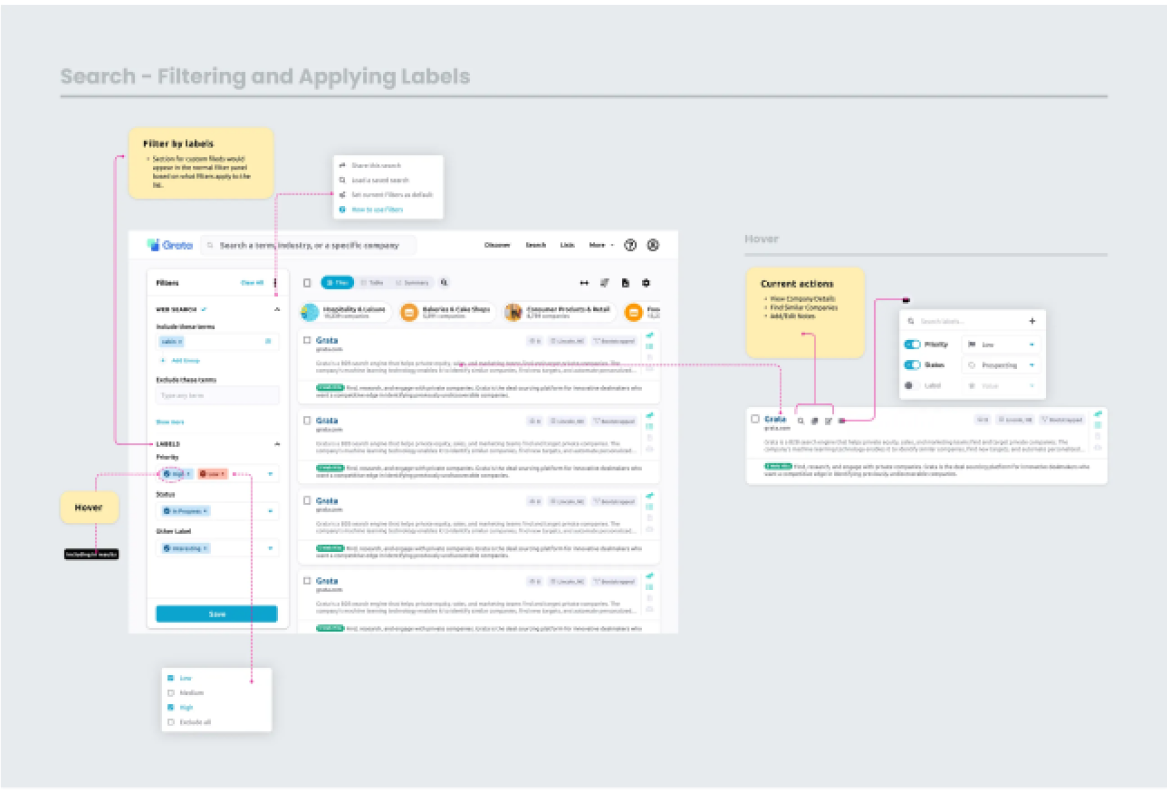
🤝 Developer Handoff
Detailed notes, flows and prototypes helped us communicate the intent of every feature we designed
💰 4x Increase in Traffic

🚀 High Impact Features
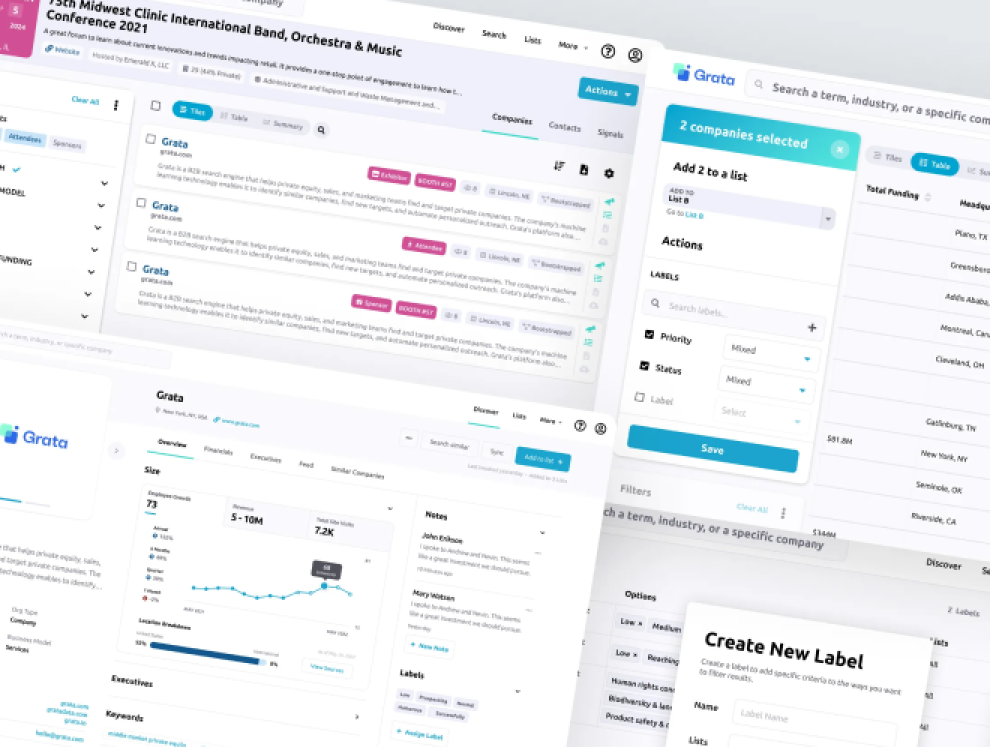
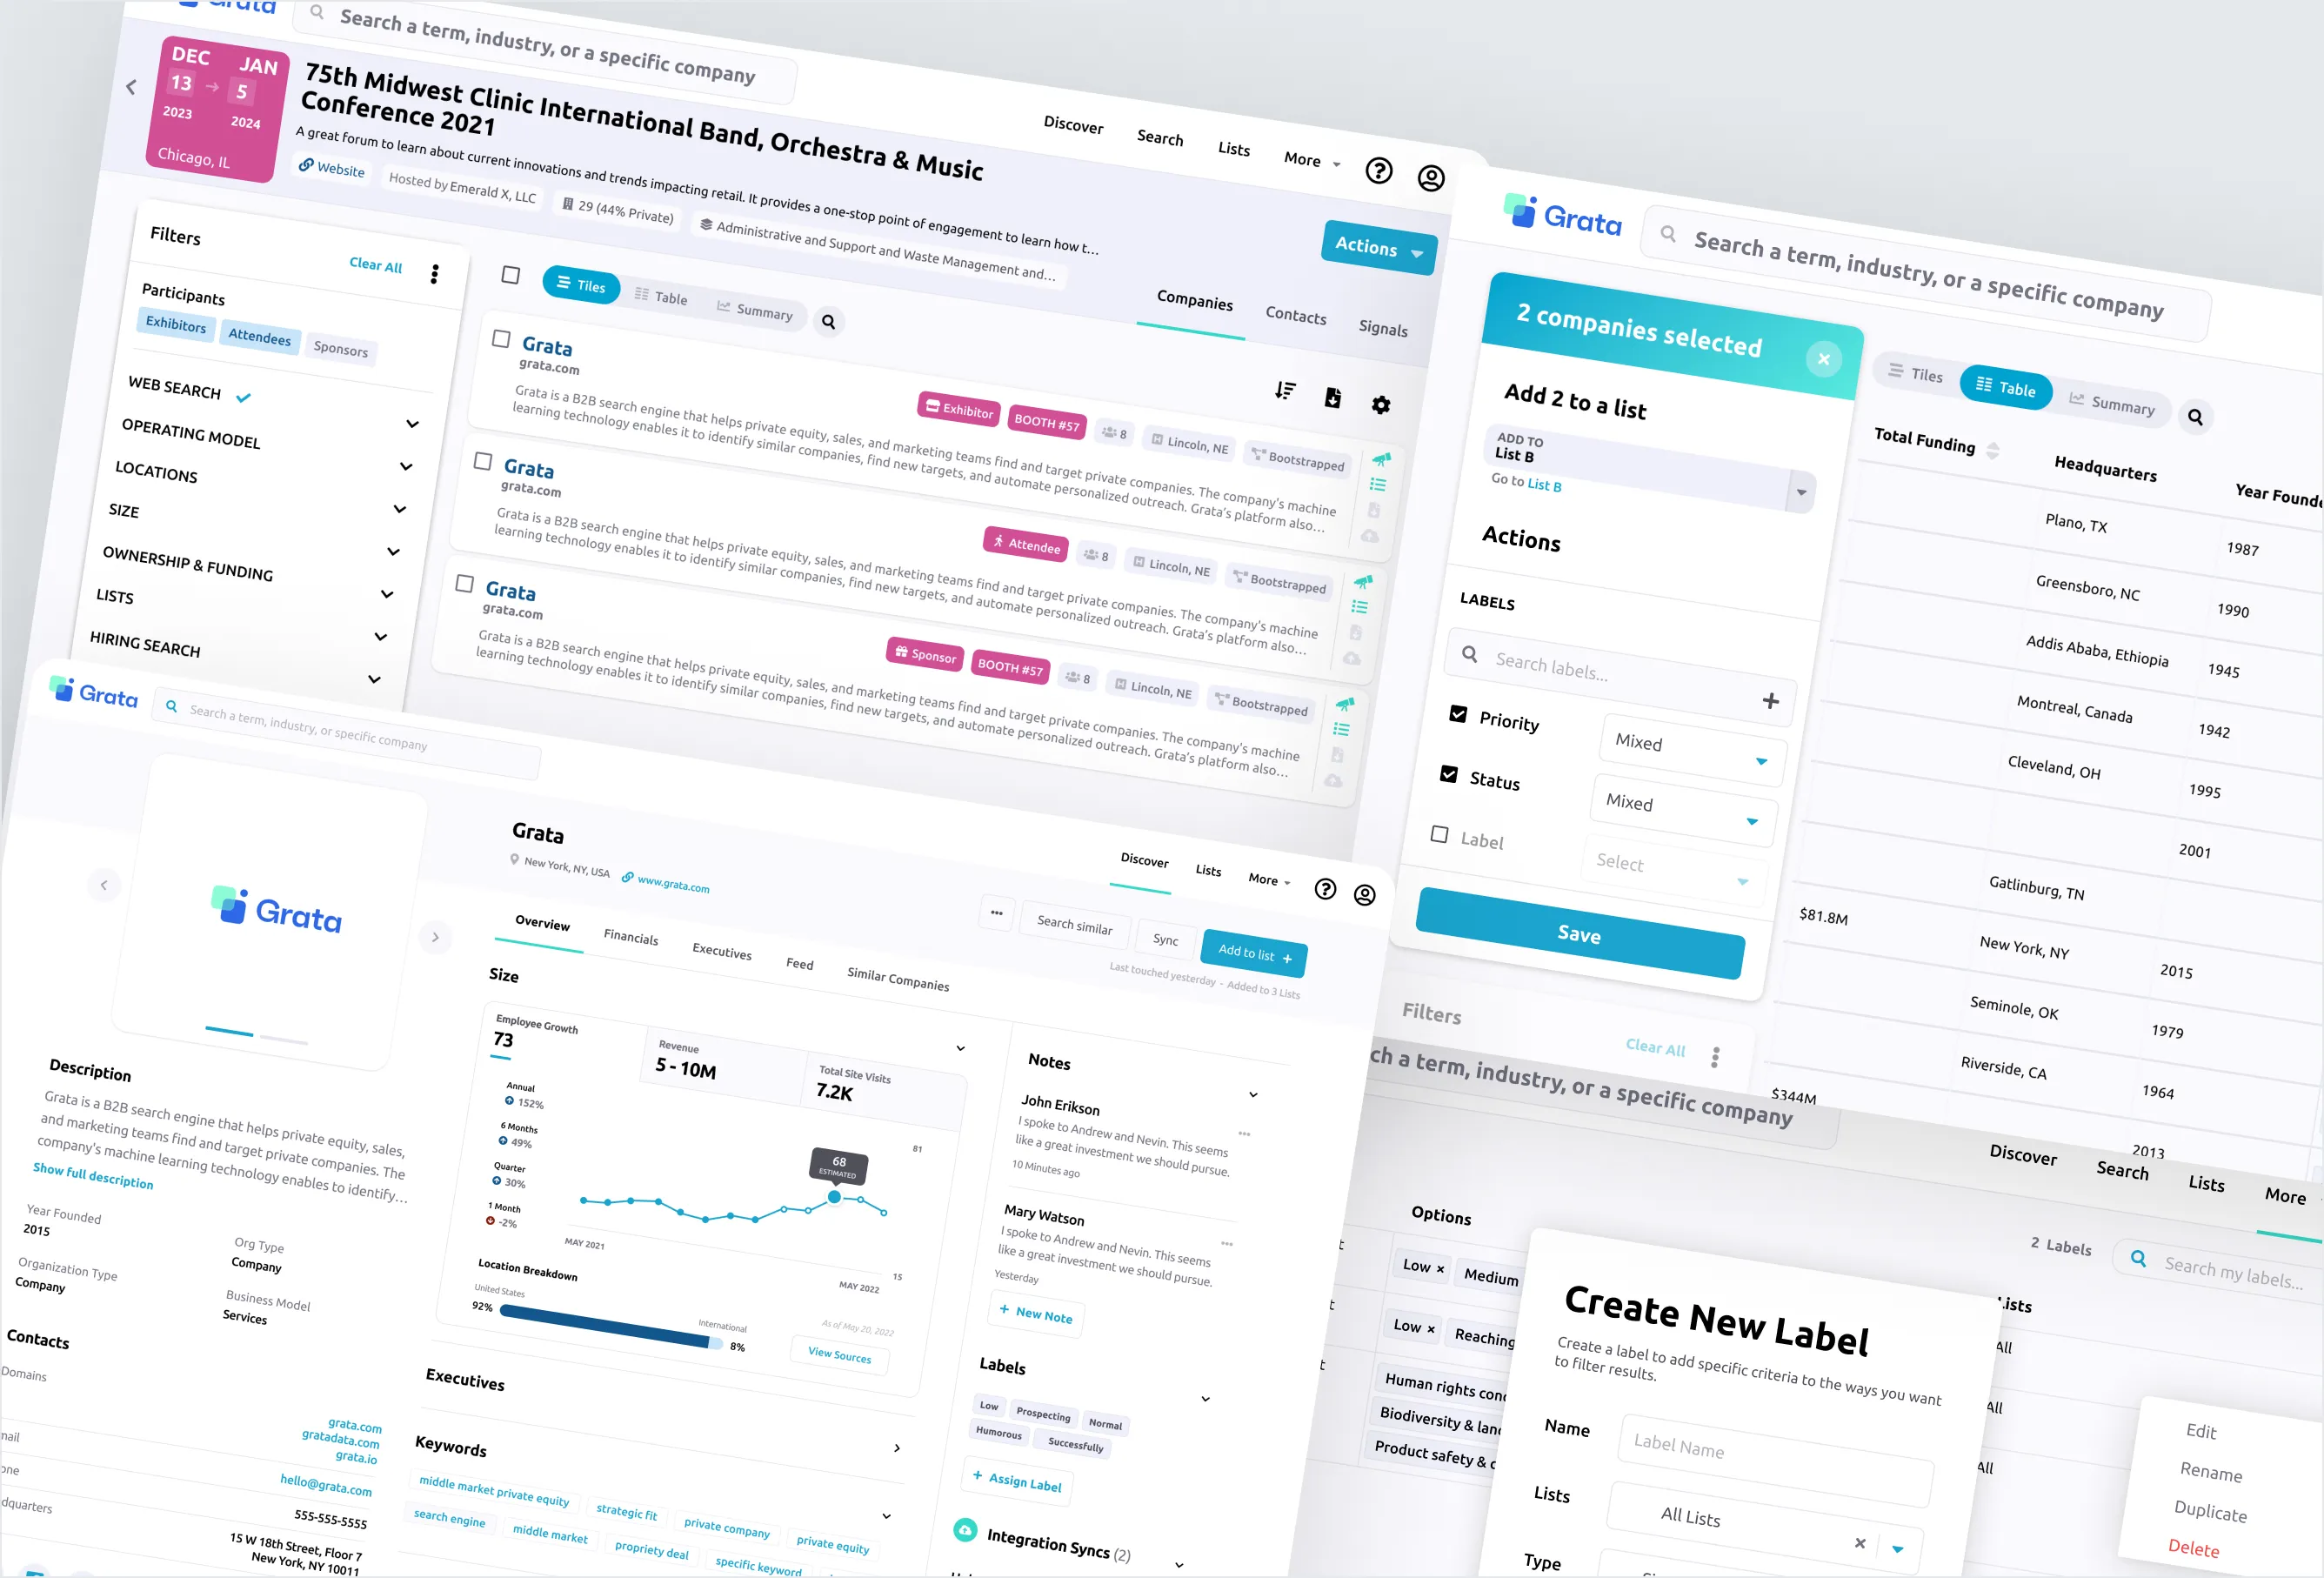
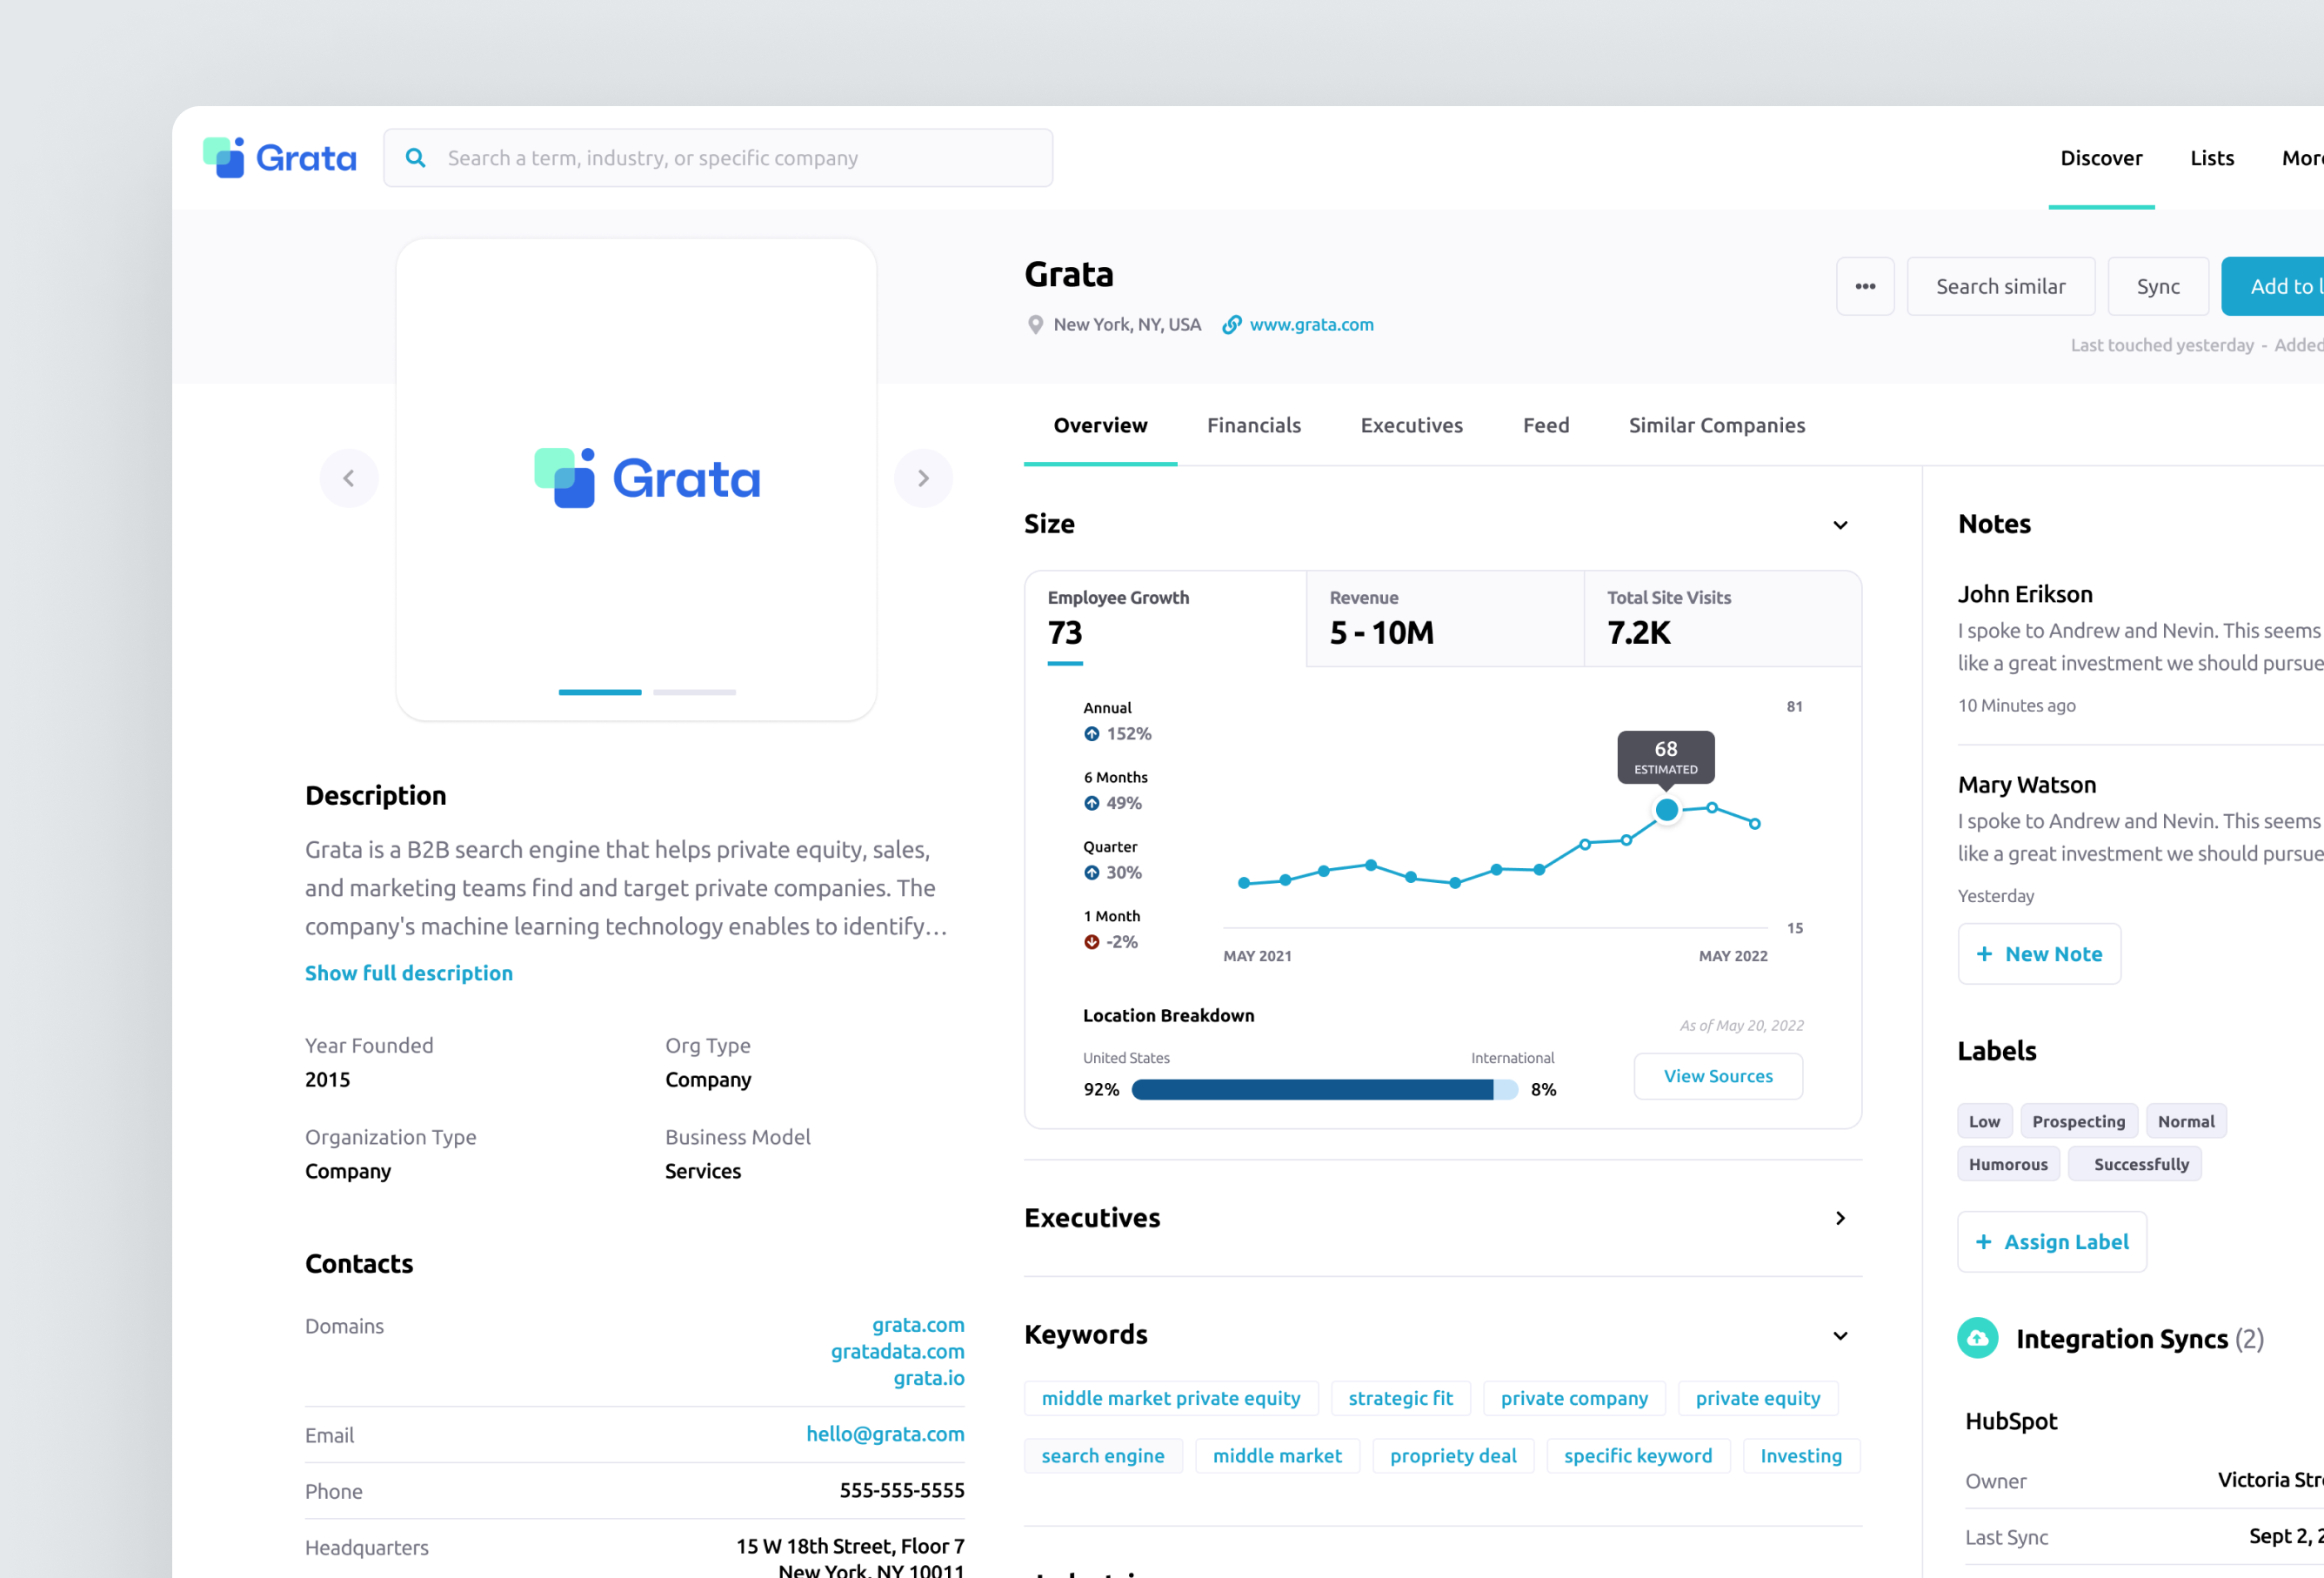
We worked on many high impact features such as lists, conferences, filters, pipeline, company details, and more
Overview
Grata is a New York-based startup that provides dealmakers with cutting edge tools to find key information about private, mid-market companies. They needed to move quickly and called on UX Cabin to help execute on their feature roadmap.
Background
Finding information about private companies is notoriously difficult. It is fragmented, hard to find, and potentially out of date. This impacts dealmaker confidence and means that thousands of companies that could benefit from investment are left in the dark.
Grata brings the power of machine learning to automatically source and analyze the most relevant insights. With Grata, Dealmakers are able to use powerful features to search, source, and keep track of companies that fit their investment strategies.
Objectives
- Plug into Grata’s product development team as quickly as possible
- Design within Grata’s existing design principles and brand guidelines
- Make the designer to developer hand-off as seamless as possible
“I would recommend any other startup that needs to move quickly, that needs great quality design work to work with your team.”

Pallavi Pal
VP of Product Management, Grata
Design Process
UX Cabin shipped a number of features for the Grata team. Feature requirements, user stories, and acceptance criteria were communicated during weekly meetings.
UX Cabin designers created medium and high-fidelity mockups and provided clickable prototypes and loom video walkthroughs whenever appropriate.
Principles
- User-centered design: Prioritize user needs and goals.
- Functionality: Enable key tasks for users.
- Usability: Make design intuitive and easy to use.
- Flexibility: Accommodate various use cases.
- Consistency: Follow brand guidelines and design system.
“I’ve worked with a lot of design freelancers, contractors, and working with your team has been fantastic for us.”
Pallavi Pal
VP of Product Management, Grata
Feature: Pipeline View
Grata users wanted a way to keep track of companies that they were following in a way that would provide visibility to where they might fall in a CRM-like deal-making pipeline. The pipeline view would take companies that a user had added to their personal lists and display them in a kan ban style view. This was a brand new feature.
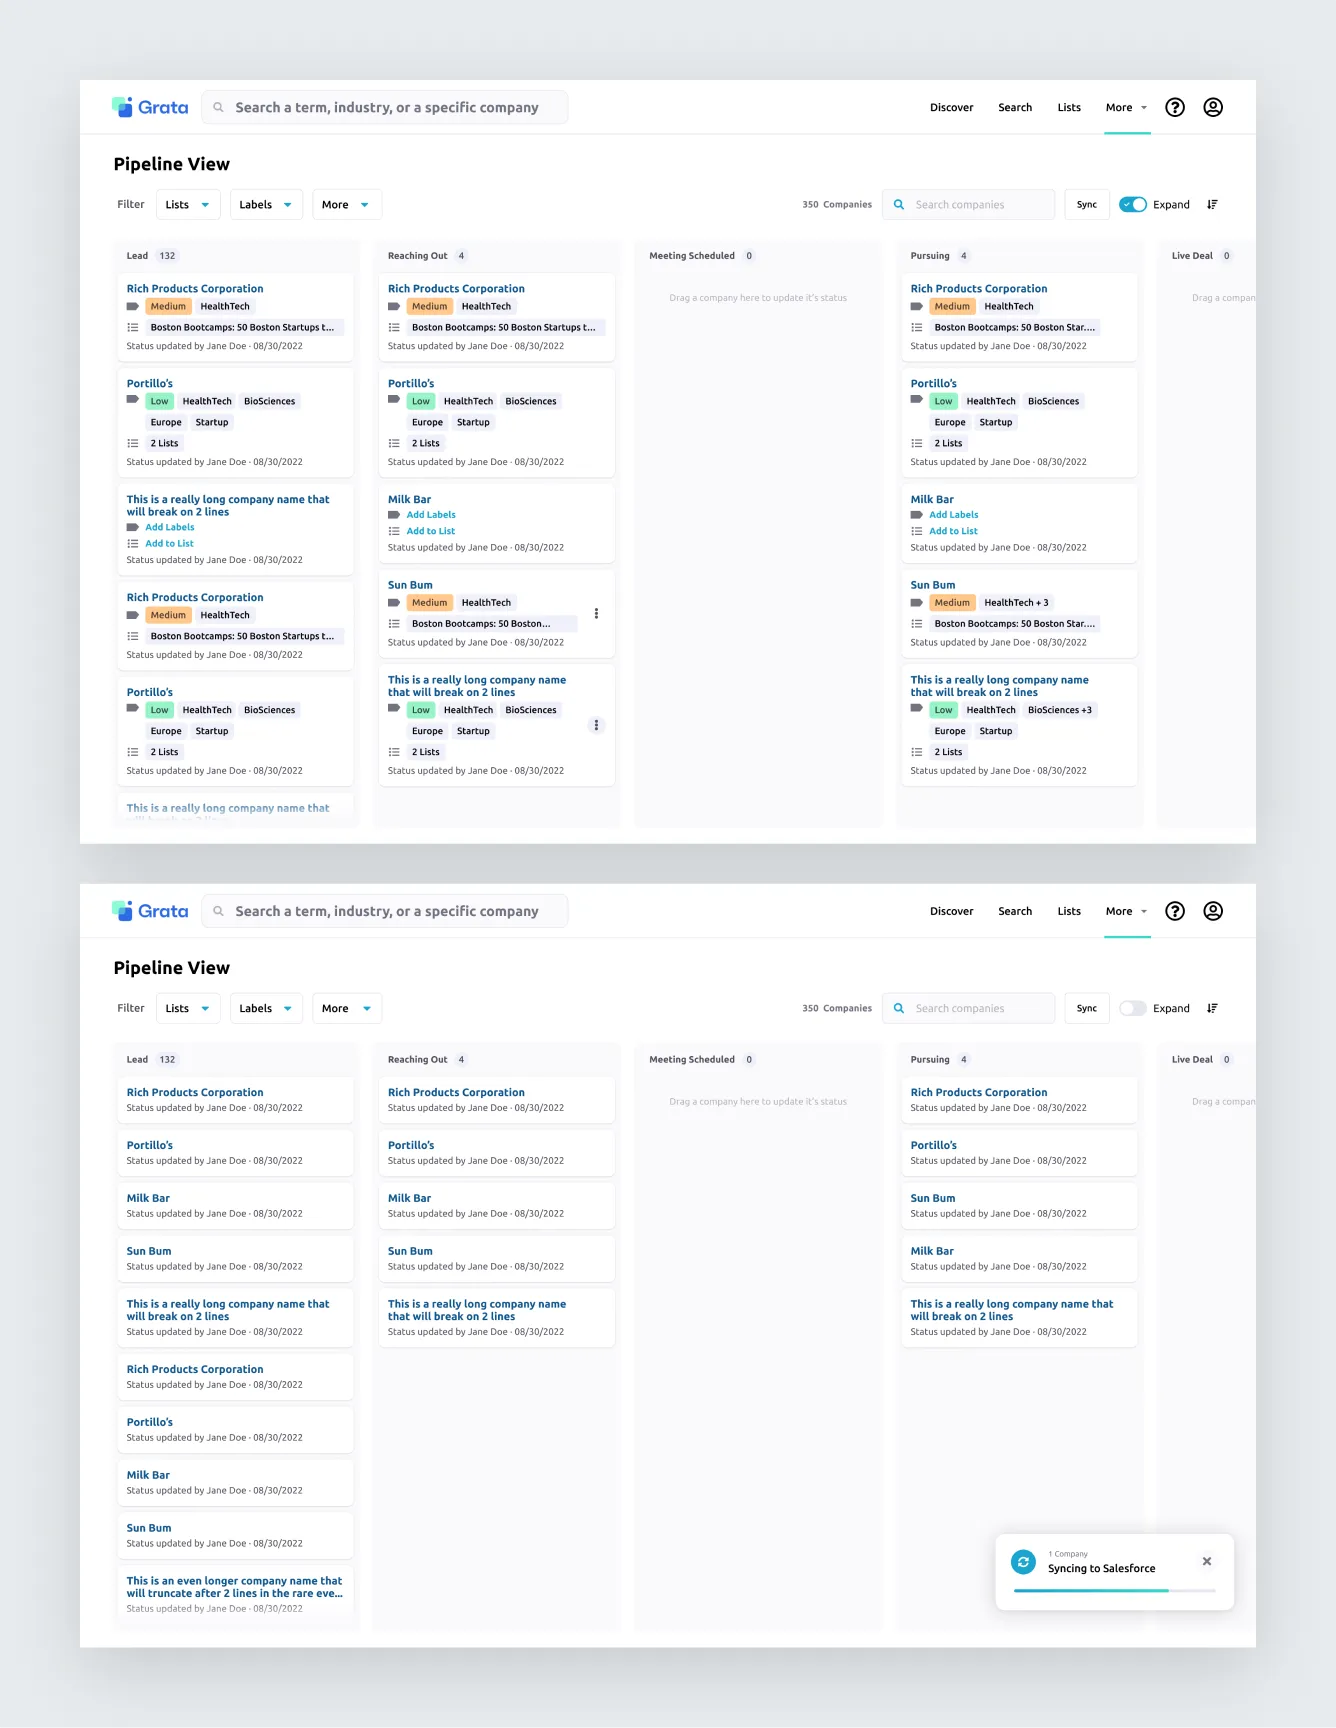
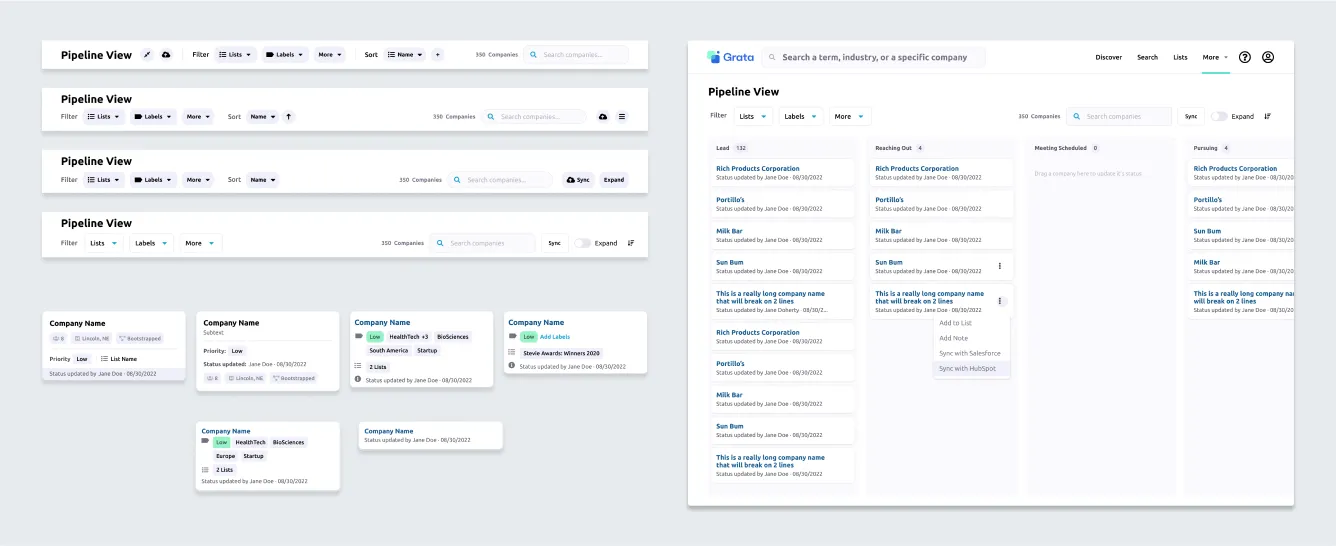
Evolution of Pipeline View
This feature evolved to surface key information about a company in a way that would still be scannable. Company cards in each column originally only had the name and status chip. Feedback from the Grata team influenced the designs to include additional information like custom fields and the lists that a company might belong to.
This additional information increased the size of each card. This could be problematic for users who might have hundreds of companies in the pipeline view. To help address this, functionality was introduced that allowed the user to toggle the cards between a collapsed and expanded view. This could be done on the individual card level, column-level, and the global level (all cards within all columns).
Feature: Conferences
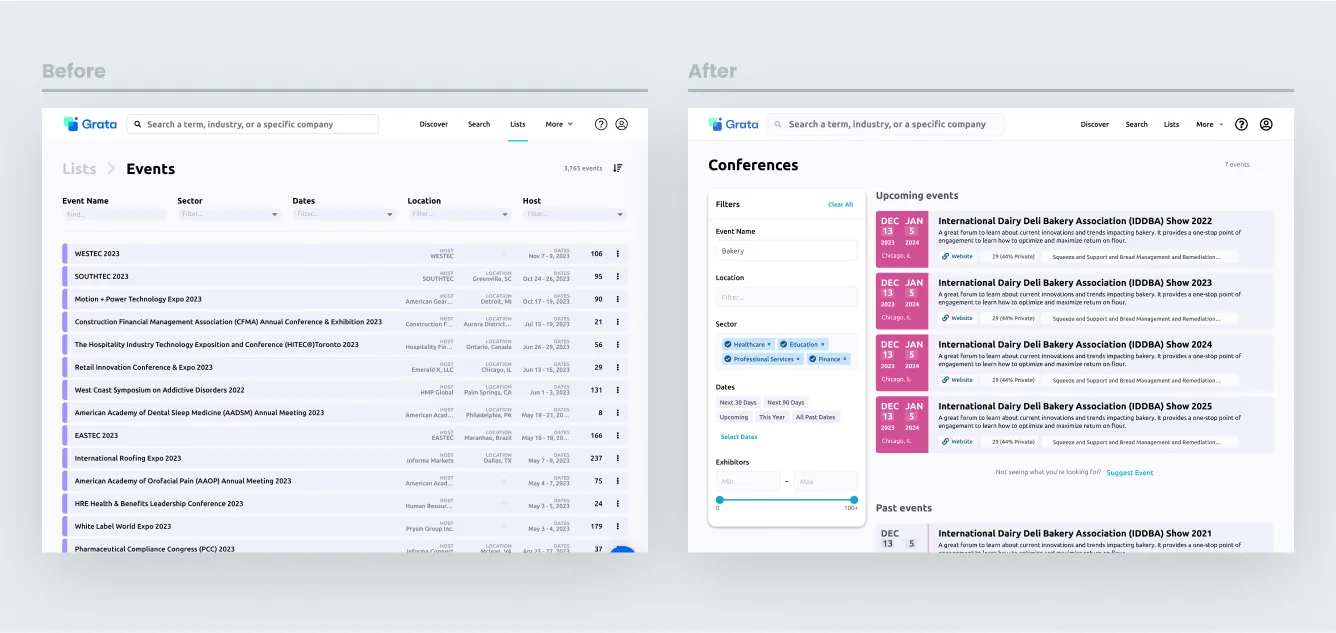
Dealmakers want to have visibility into which companies are attending which events, as this is a goldmine of information that can inform investment strategies.
Users were able to see event-related information such as the name, description, location, website, and exhibitor attendance. The updates included displaying additional information such as NAICS 2 sectors and exhibitors, and gave users the ability to sort and save events they were interested in.
Evolution of Conferences
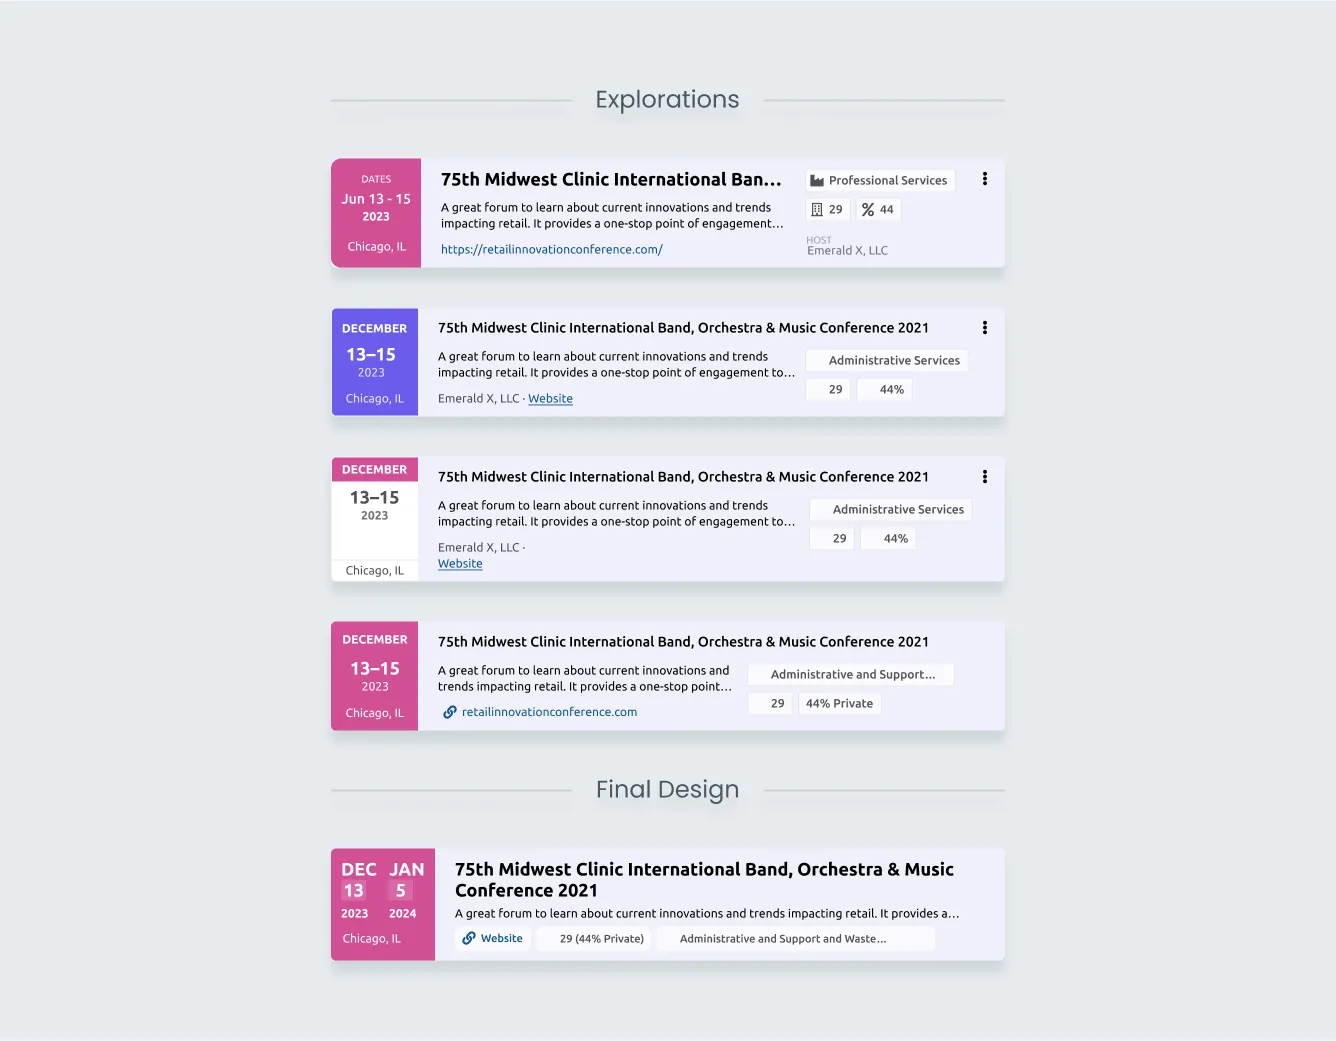
There were a few challenges with how to display the date of the event. Events could be a single date, date range within the same month, date range spanning different months within the same year, and a date range spanning different months and different years (i.e December 29, 2022–January 3, 2023).
The design had to accommodate each of these variations and still look great!
Feature: Lists
A core feature within Grata was to allow users to group and organize companies of interest. This layer of organization was the backbone of other features and reporting related functionality.
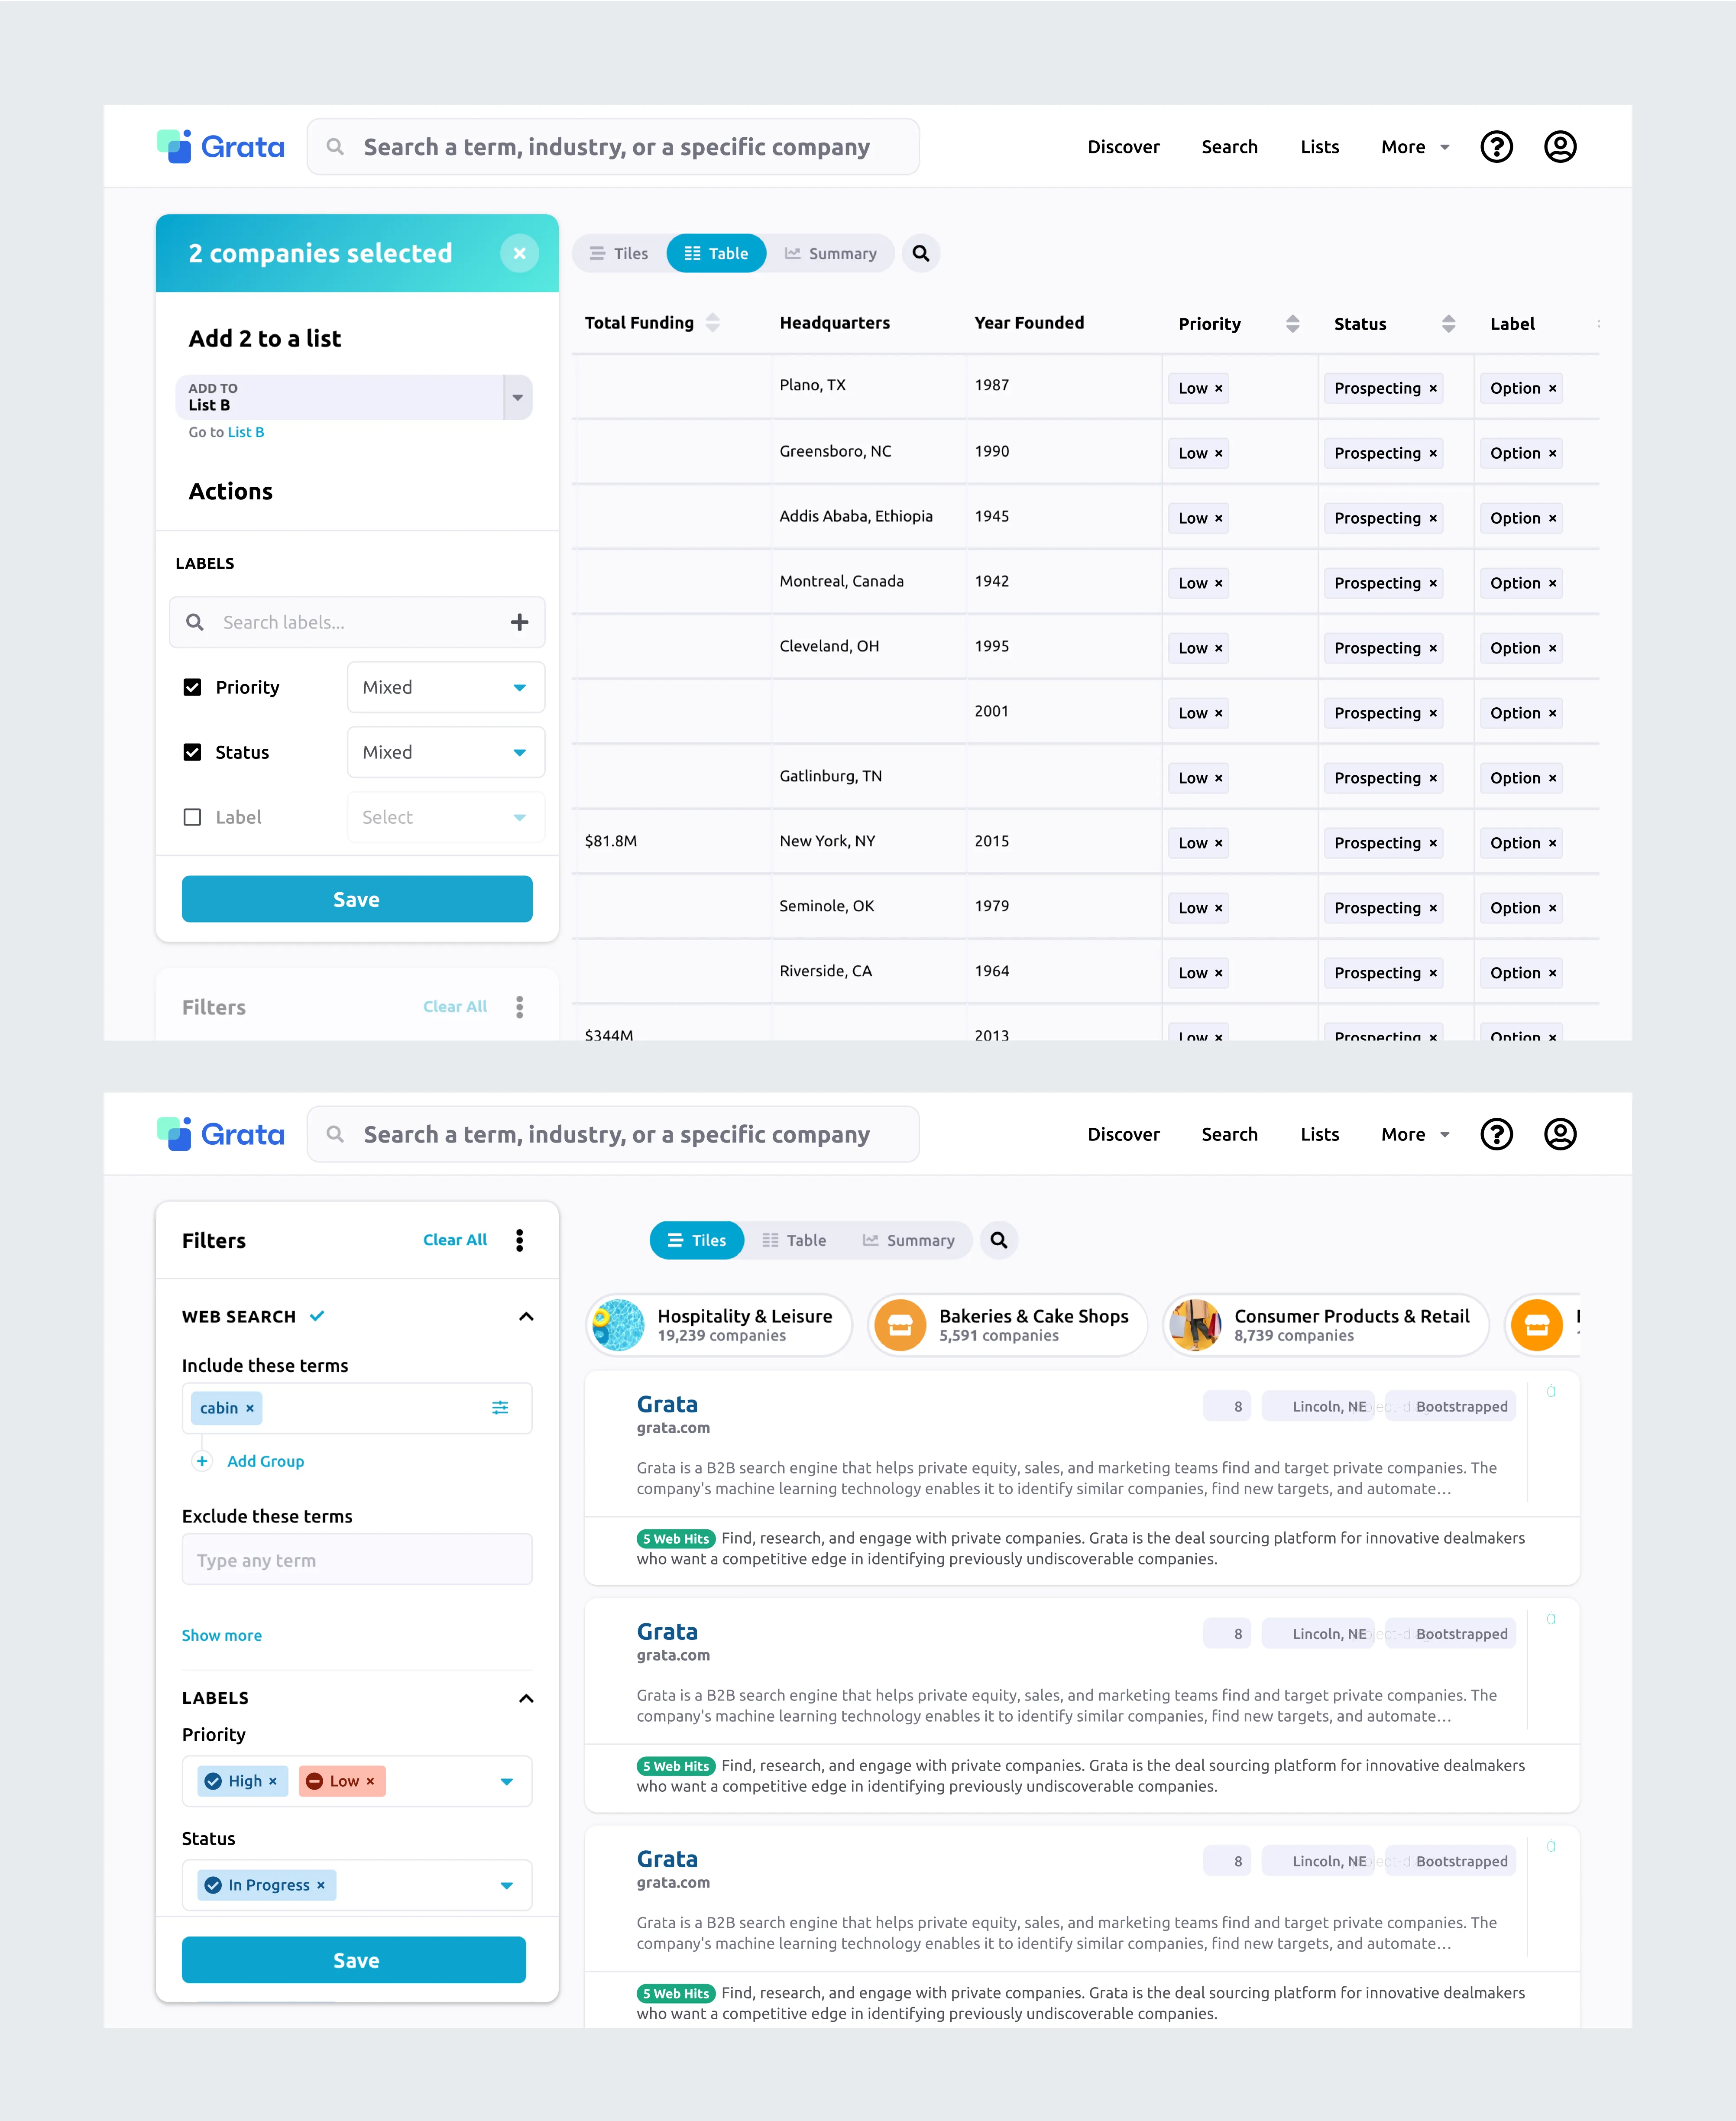
Grata wanted to evolve lists with the ability for custom fields to be added. These fields could be set up by the user to work in whatever capacity they needed (custom statuses, attributes, phases, etc.).
Evolution of Lists
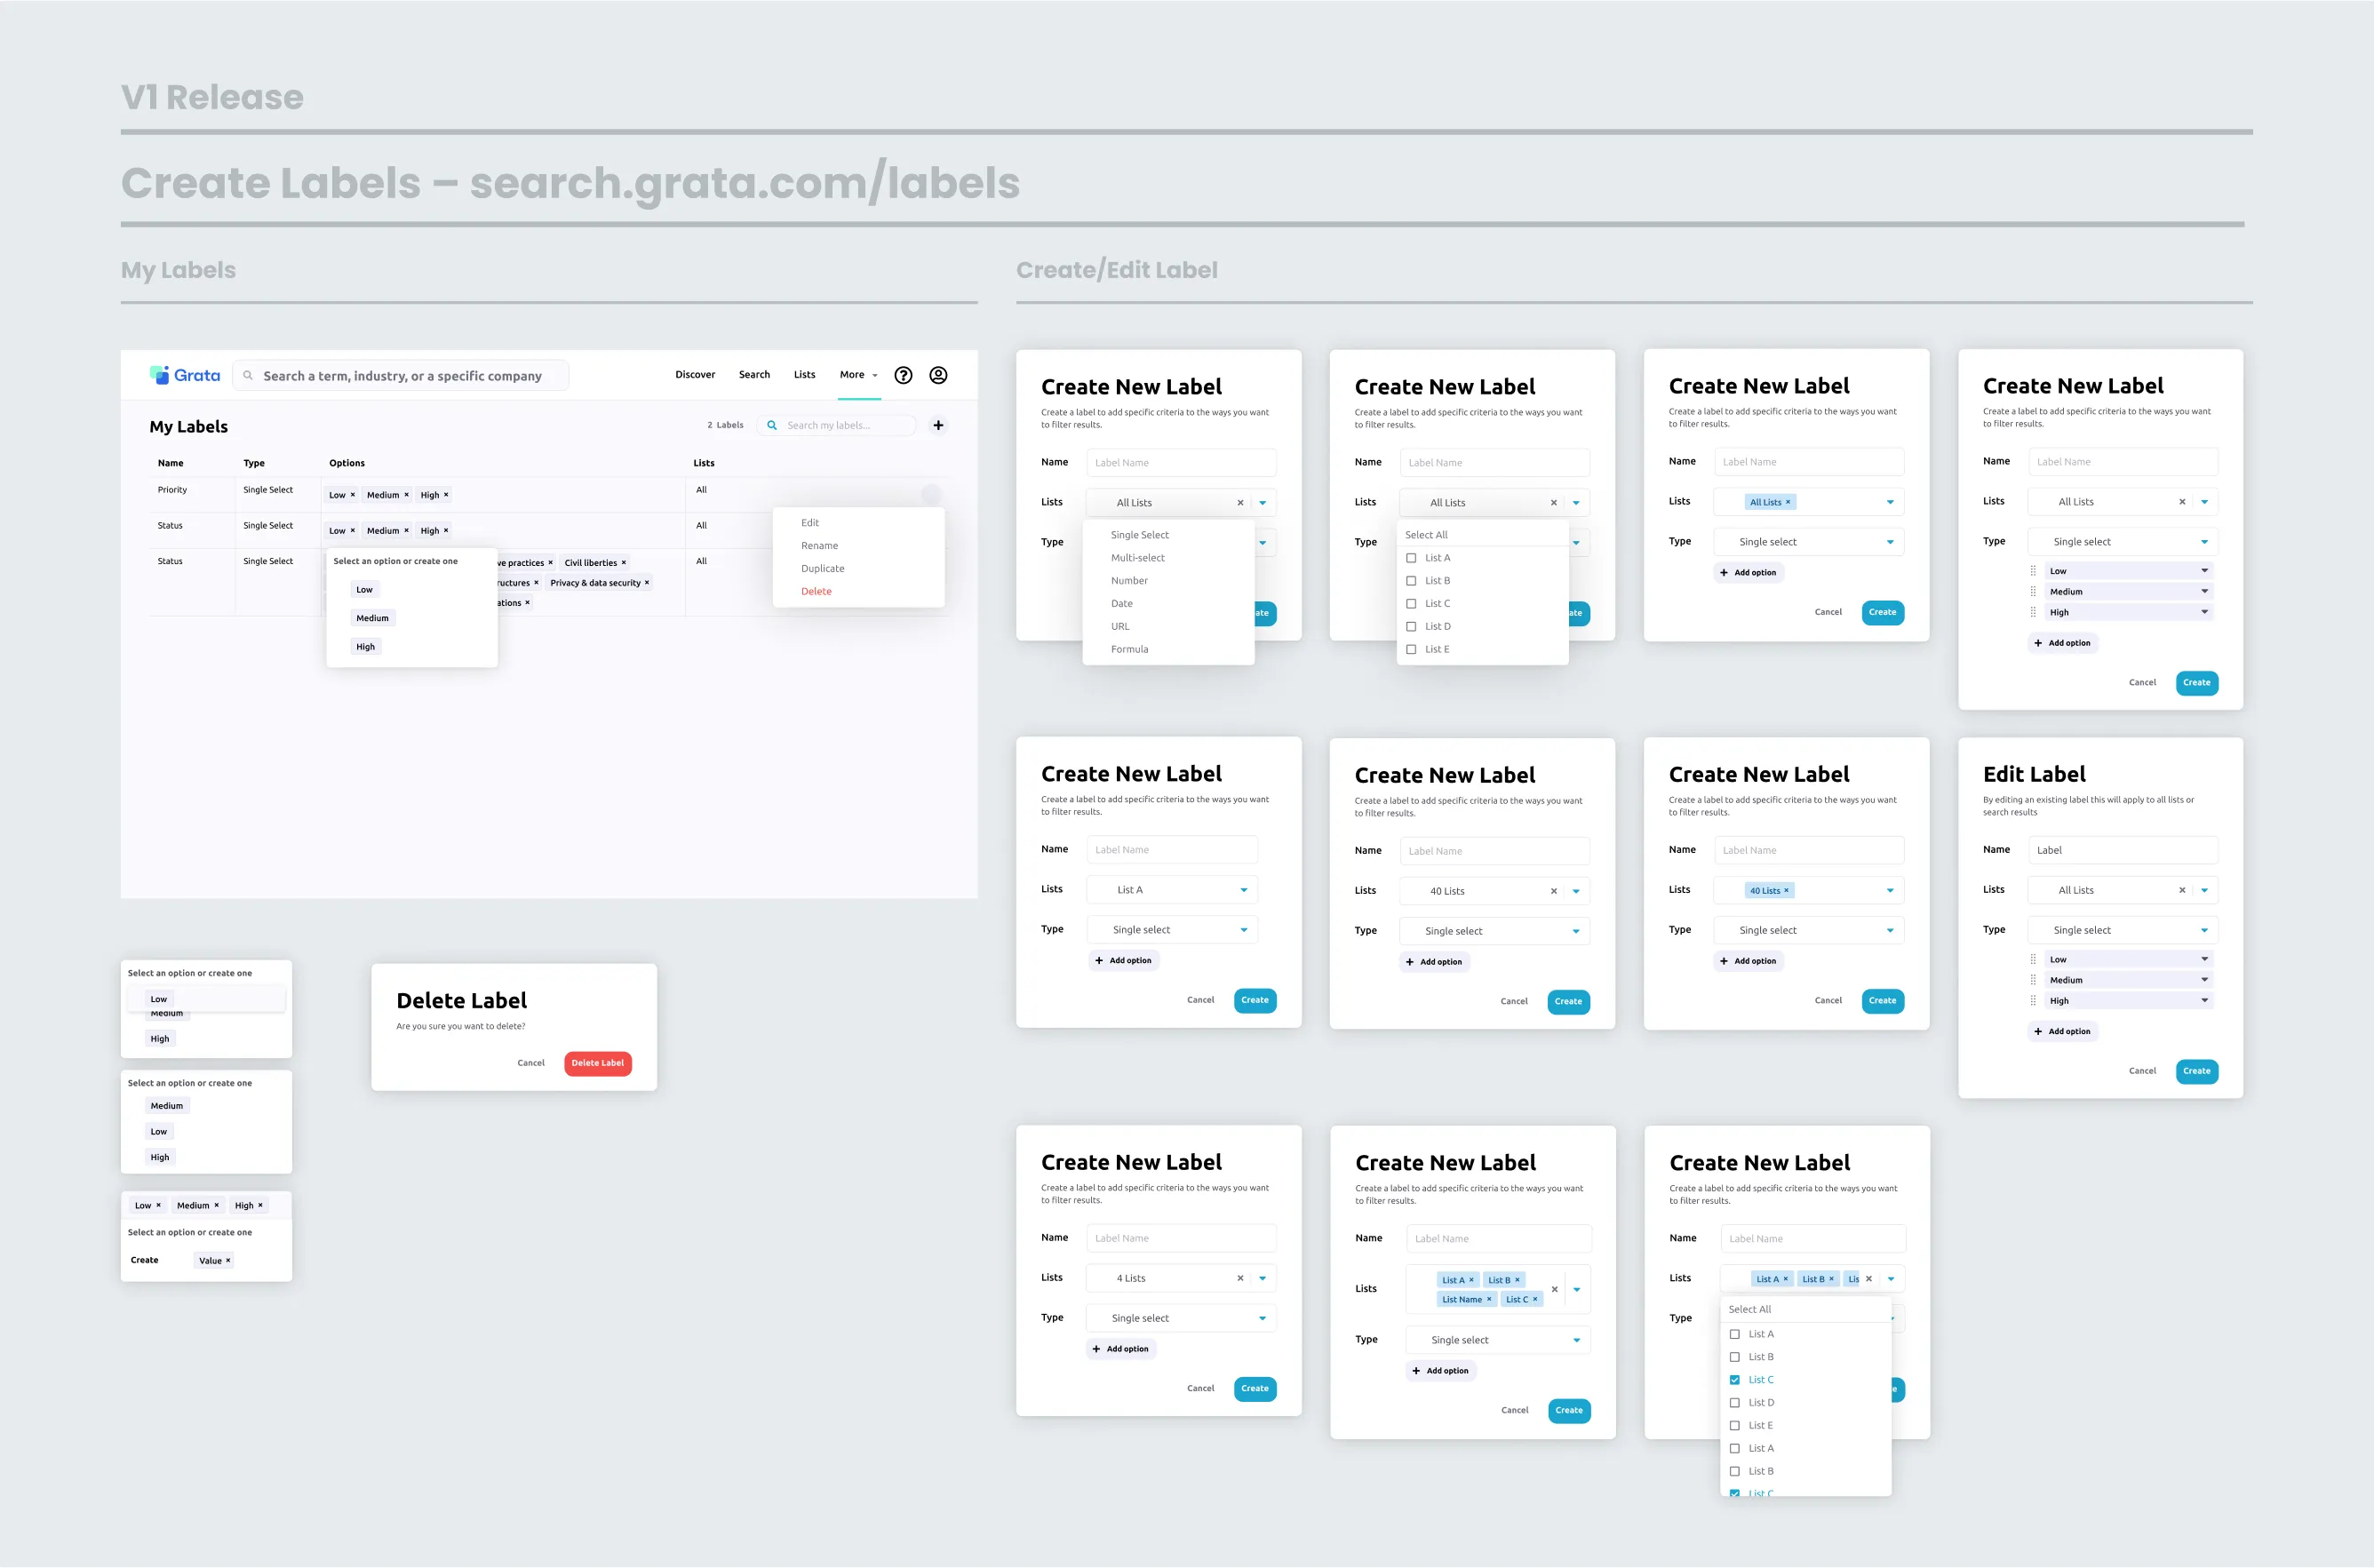
There were a number of touch points that were impacted by the addition of custom fields. These included the creation and configuring of custom fields, adding them to different lists, and using them as filters in listing pages.
The designs had to be flexible enough to accommodate future additions for custom field support (adding more complex field types) without compromising the acceptance criteria that was defined for the initial version.
Feature: NAICS Lookup
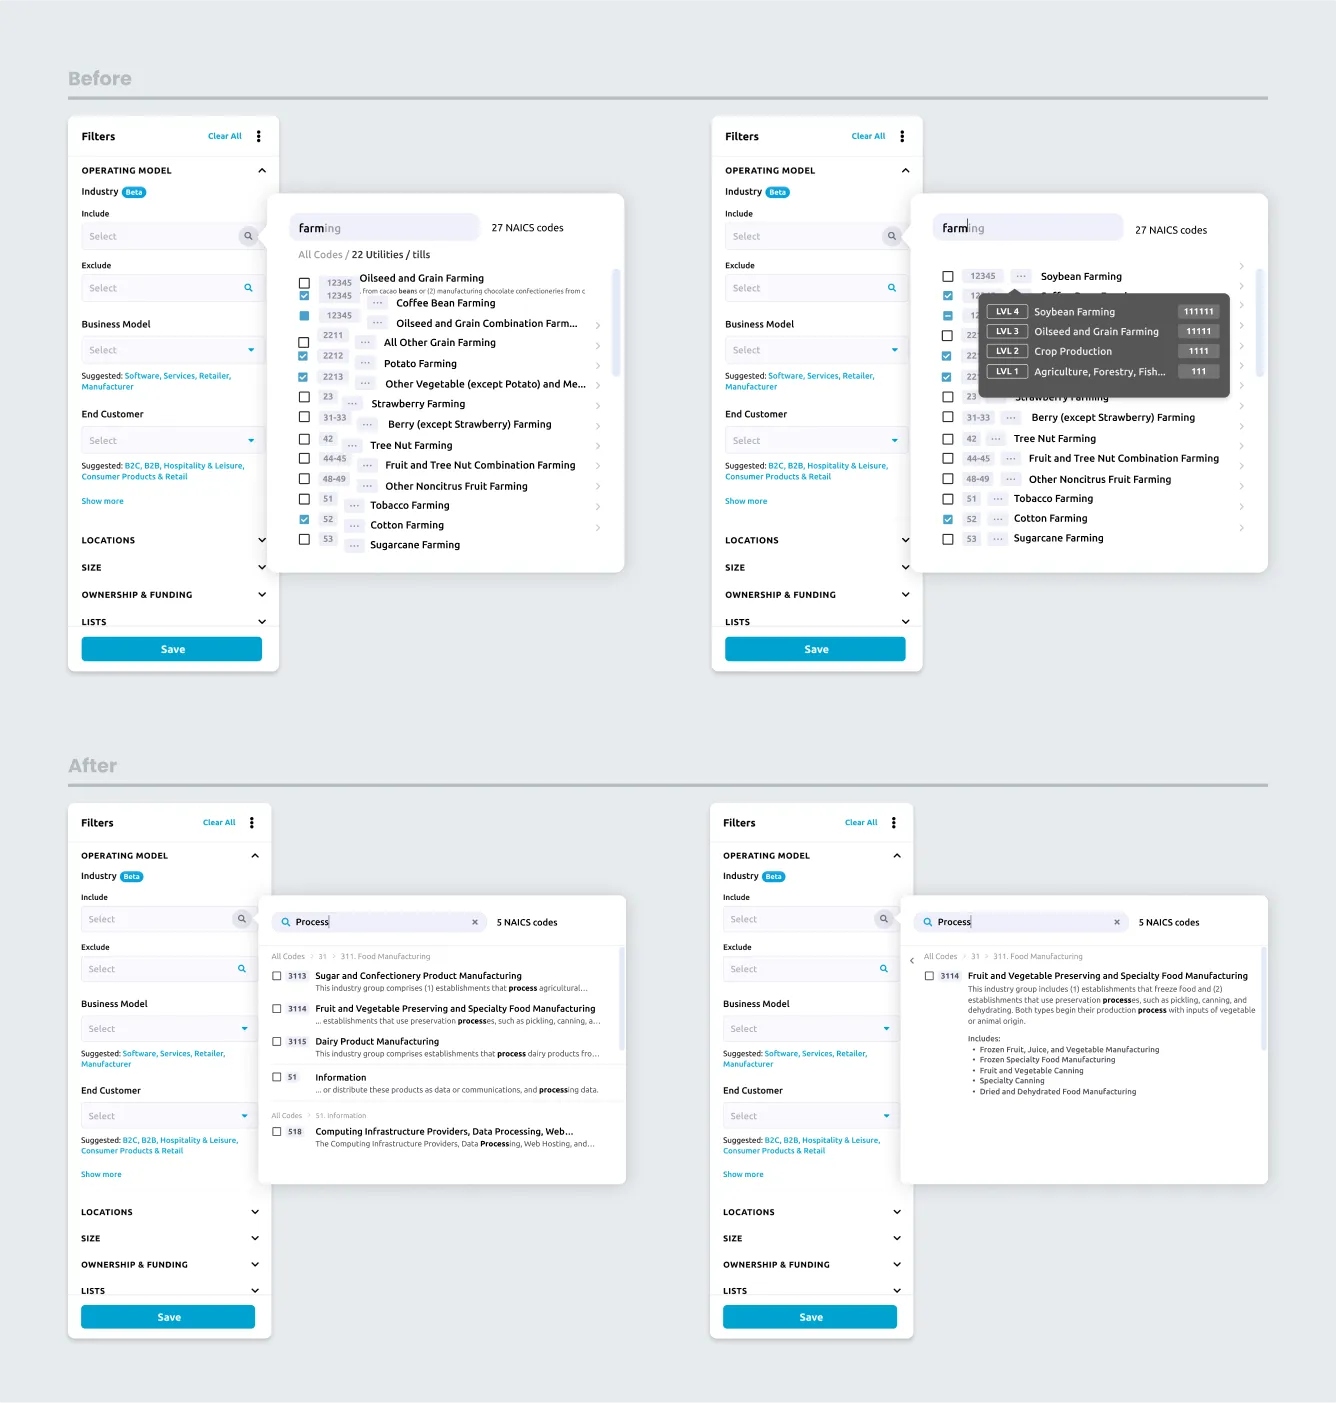
Users can search for companies by sector using the North American Industry Classification System (NAICS). NAICS codes classify businesses based on their type of economic activity. The first two digits of the code represent the primary business sector, while the remaining digits represent sub-sectors, industry groups, and specific industries.
This update allowed for additional metadata to be scraped from NAICS data during the search process, which resulted in a faster and more effective experience.
Evolution of NAICS Lookup
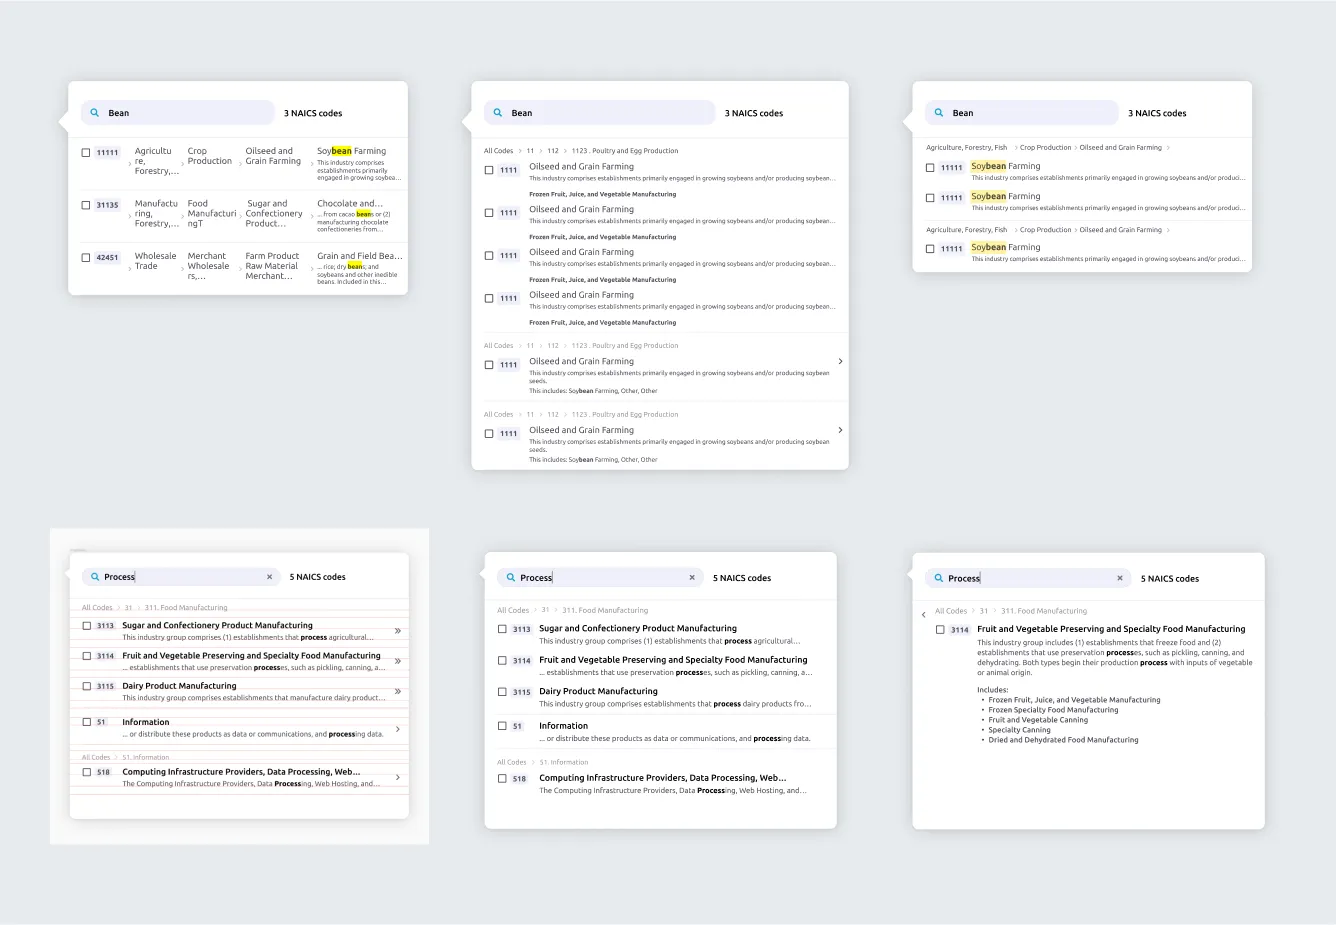
Creating a dropdown menu that would allow users to search and find information that was hierarchical and scannable proved challenging. The new menu displays the title and a description fragment where the search term matches and shows the path to the code as a series of breadcrumbs.
For the final level within a NAICS code, a new icon was displayed along with the description. These additions brought more clarity to users for which level of a NAICS code they were viewing.
Developer Handoff
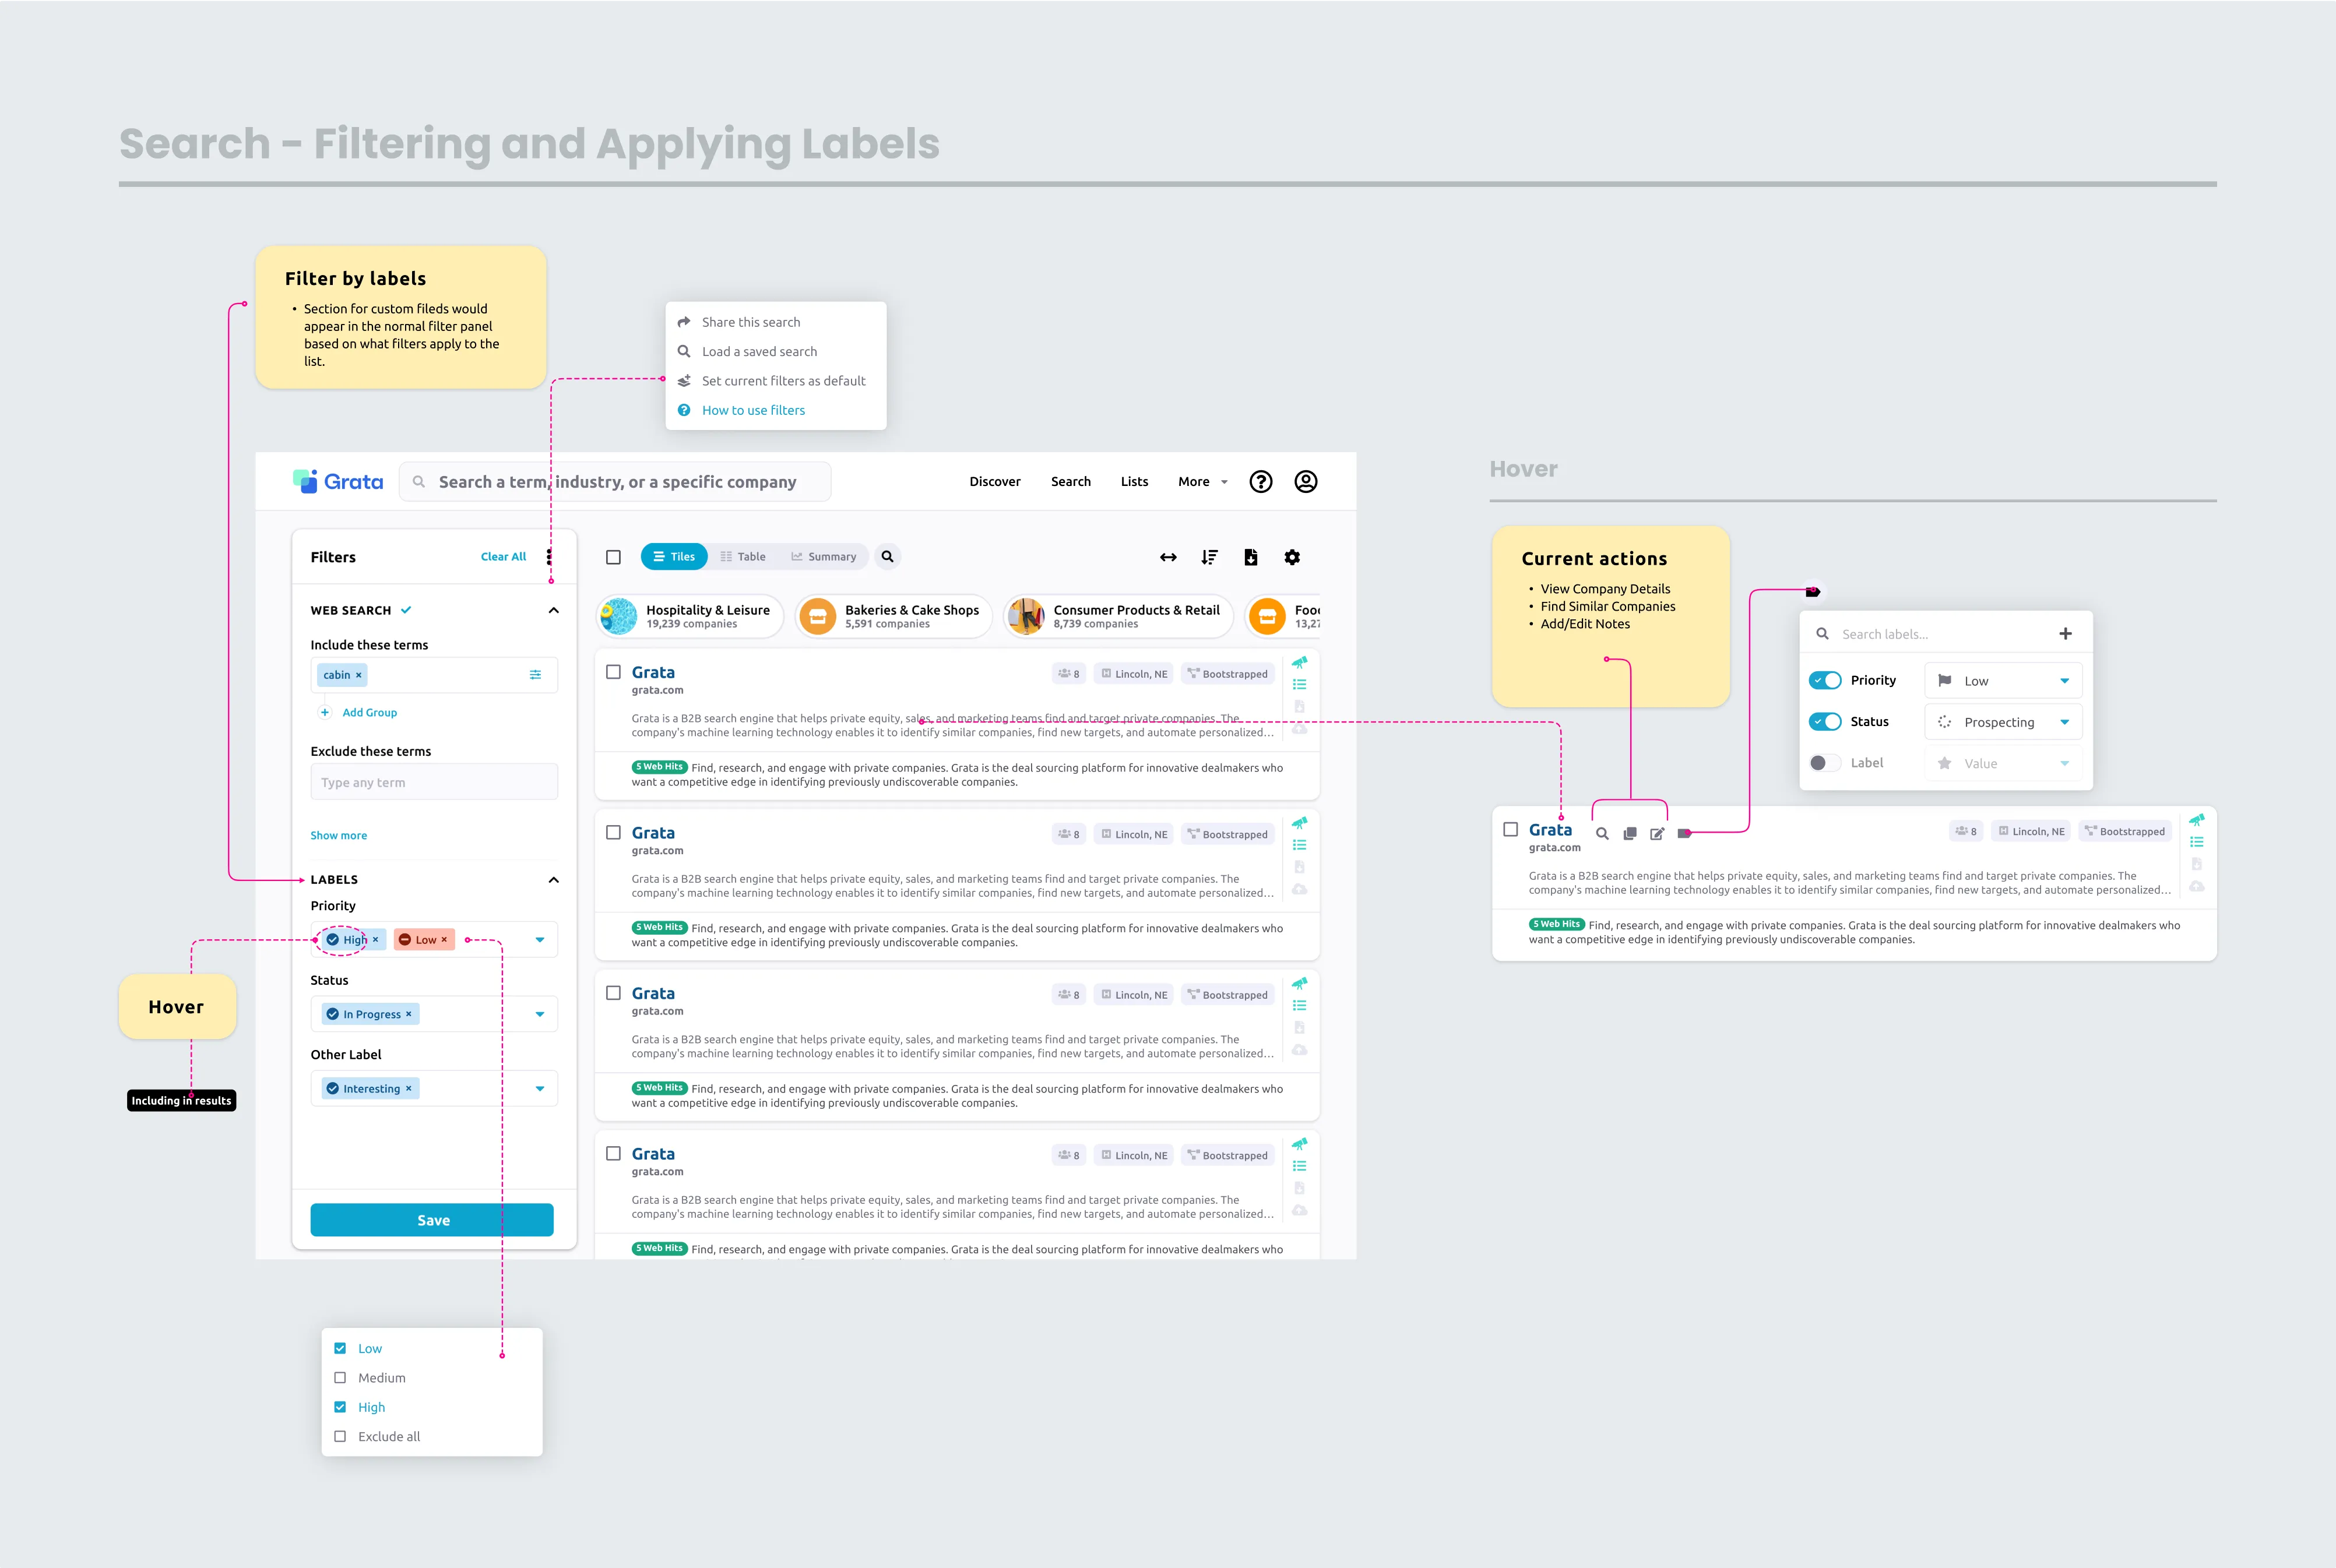
A clean handoff process was crucial to ensure smooth and efficient collaboration between UX Cabin and the Grata team. This process involved the clear and organized transfer of designs, documentation, and other information.
This process was vital for several reasons:
- It ensured the Grata team had all the required information to continue developing and implementing the design features.
- It allowed clear communication and a precise understanding of what was delivered and what needed to be done to continue on the project.
- It avoided confusion, misunderstandings, and delays, which can cause the project to fall behind schedule and lead to client dissatisfaction.
Final Results
The UX Cabin team was able to fast-track key features for the Grata team over a 5-month engagement. Design hand-offs were delivered using Figma and Loom videos for any needed walkthroughs.
Shoutout to the Grata team for being a fantastic partner throughout the entire process!
“It was amazing… overall, a fantastic experience from the initial conversations… all the way to the end.”
Pallavi Pal
VP of Product Management, Grata